Most EMA indicators tell you where price has been. The EMA Trend State Engine tells you where the market is in its cycle right now — Markup, Markdown, Accumulation, Distribution, or Transition — so you stop entering at the wrong point.
A Wyckoff-inspired state machine that reads the ordering and slope direction of three EMAs — fast, mid, slow — and tells you exactly where in the cycle the market sits.
All three EMAs in bullish order and rising. The strongest long environment. A wide, expanding teal cloud means momentum is building. A compressing cloud means the move may be maturing.
All three EMAs in bearish order and falling. The strongest short environment. A wide, expanding red cloud means selling momentum is strong. Compression signals the move is aging.
After a Markdown phase — bearish order but EMAs have stopped falling. Selling pressure has dried up. Smart money builds positions here before the next Markup phase begins.
After a Markup phase — bullish order but EMAs have stopped rising. Buying pressure is fading. Early longs take profit here before the next Markdown phase begins.
Mixed EMA order — the market is between phases. No clear directional edge exists. A grey cloud means choppy conditions where forcing trades is most likely to cost you.
The colour-coded cloud tells the complete story — Markdown turning to Accumulation turning to Markup, visible in a single glance.
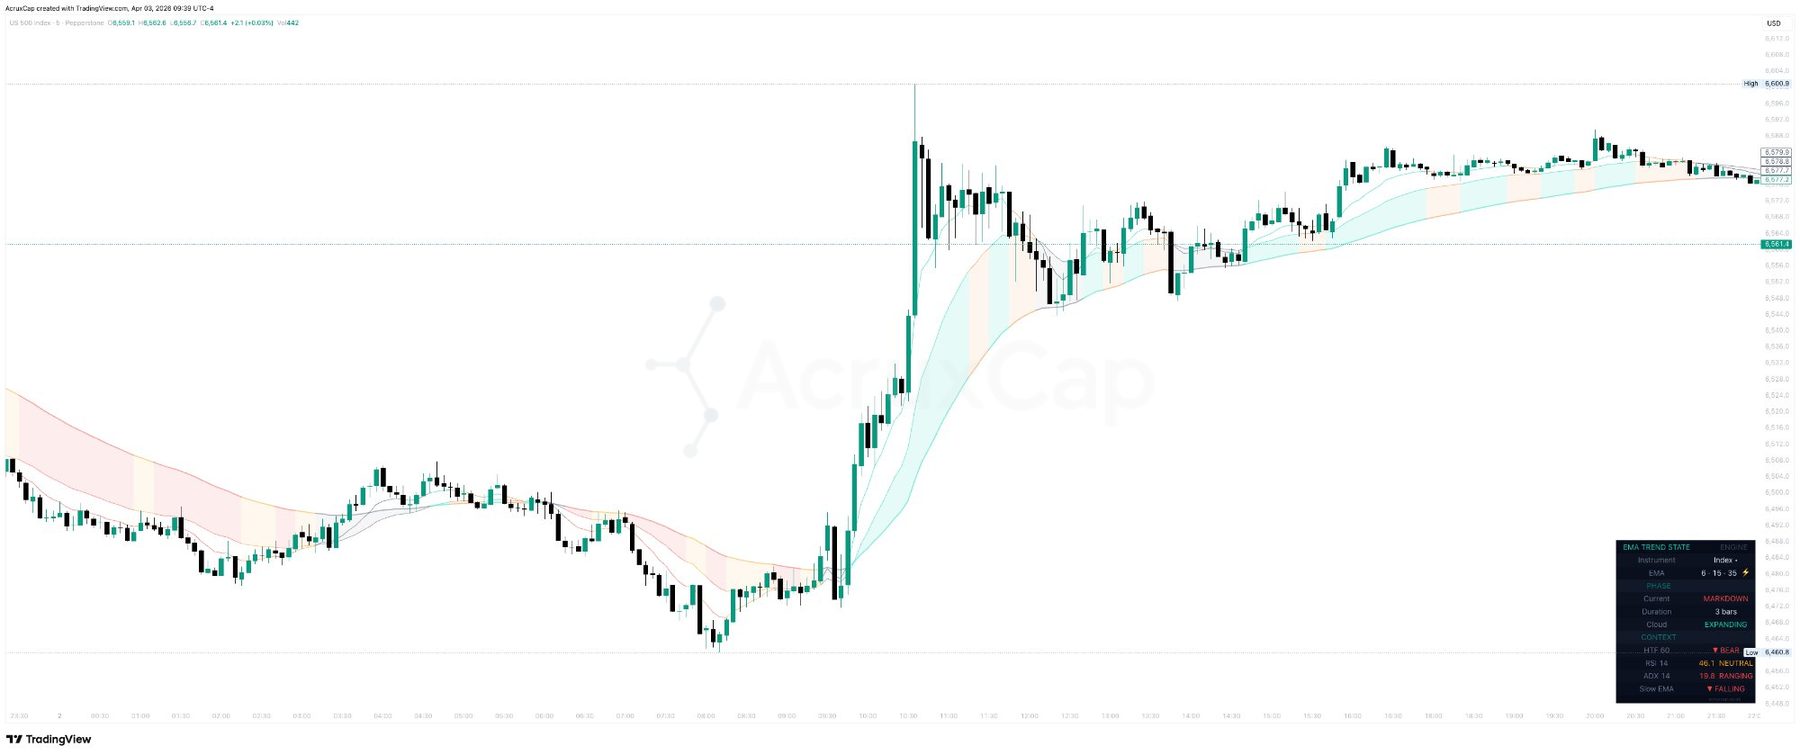
The adaptive EMA cloud shifts from red (Markdown) through amber (Accumulation) to teal (Markup) as the market cycles through phases. A wide, expanding teal cloud confirms strong bullish momentum. The dashboard bottom-right shows detected instrument class, adaptive EMA lengths, current phase and duration, cloud expansion status, HTF bias, RSI, and ADX in real time.
Buying a breakout during Distribution. Shorting a dip during Markup. The technique was fine — the context was wrong. The EMA Trend State Engine solves this by telling you which phase the market is in before you look at any signal or setup.
It doesn't generate buy or sell signals. That's deliberate. It gives you the context to make those decisions yourself — or to filter signals from any indicator you use alongside it.
Before entering any position, glance at the cloud colour. Teal = look for longs. Red = look for shorts. Amber or orange = be patient. Grey = stay out or reduce size.
When the cloud shifts from Accumulation to Markup, the market is transitioning from basing to trending. Combine this with your entry criteria for a high-context long setup.
When a wide teal cloud starts narrowing, the Markup phase is maturing. When it shifts to orange, the uptrend is likely ending. Tighten stops or take profit on existing longs.
Overlay on any AcruxCap indicator. If your buy signal fires during Markup, the phase agrees. If it fires during Transition or Distribution, it doesn't — and you can choose to skip it.
Overlay the EMA Trend State Engine alongside any AcruxCap indicator — or any third-party tool — to add phase context to every signal.
Use the cloud to confirm directional bias before taking order block entries. Only take bullish OB setups during Markup. Only take bearish OB setups during Markdown.
Use the phase to filter HMA crossover signals. Buy signals during Markup, sell signals during Markdown. Skip signals firing in Transition or against the phase.
During Markup, focus exclusively on buy-side scalps. During Markdown, sell-side only. During Transition, reduce size or wait for the next phase confirmation.
Mean reversion setups work best in Transition, Accumulation, and Distribution. Trend-following setups work best in Markup and Markdown. The phase tells you which mode to be in.
The area between the Mid and Slow EMA fills with colour based on the current phase — teal (Markup), red (Markdown), amber (Accumulation), orange (Distribution), grey (Transition). ATR-normalised width so it reads consistently across instruments.
EMA lengths adapt to ATR volatility automatically — expanding in low volatility to filter chop, contracting in high volatility to stay responsive. Clamped 0.7×–1.4×. Fully configurable or fixed manual lengths.
Accumulation only valid after Markdown or Transition. Distribution only valid after Markup or Transition. This prevents false classification — a pullback in an uptrend doesn't get mislabelled as Accumulation.
Instrument class, adaptive EMA lengths, current phase and duration, cloud expansion status, HTF EMA bias, RSI with label, ADX with trend classification, and slow EMA direction. Three display modes: Full, Compact, Phase Only.
The dashboard displays an amber warning when a phase exceeds 30 bars — a signal that the phase may be mature and a transition could be approaching. Configurable threshold.
TradingView alerts for each phase change — Markup, Markdown, Accumulation, Distribution. JSON webhook format includes current phase, previous phase, ticker, timeframe, and bar count. Ready for Discord, Telegram, or any automation.
Deliberately. Phase context and entry signals are different tools for different purposes. The EMA Trend State Engine tells you which phase the market is in — that informs when and in which direction to trade. The actual entry decision is yours, or comes from your entry indicator. Combining context with signal is more powerful than any single tool that tries to do both.
No. Phase classification is based on confirmed bar close data. A phase change that appeared on bar 100 will still be on bar 100 if you reload the chart next week. No future data is used in any calculation — all higher-timeframe lookups use lookahead=off.
All timeframes from 1-minute to weekly. All liquid instruments — US and global indices, forex, crypto, commodities. No session restrictions. The adaptive engine handles different volatility environments automatically based on ATR.
Transition is a mixed state where the EMAs are not in clean bullish or bearish order — the market is genuinely between phases. Accumulation is more specific: it only appears after a Markdown phase when the bearish EMA order is still intact but downward momentum has stalled. The state machine enforces this distinction to prevent false classification.
Yes. The EMA Trend State Engine is designed to complement any entry indicator, not just AcruxCap tools. Overlay it on any chart alongside any signal source. When your signal fires, check the cloud colour. If it agrees, the phase supports the trade.
When a phase has been active for more than 30 bars, the dashboard displays an amber warning. This does not mean the phase is ending — but a long-running phase is statistically more likely to be in its later stages. It is context, not a signal. The threshold is configurable.
EMA Trend State Engine is included in your AcruxCap Pro subscription alongside all eight indicators in the suite — free for early members during the launch period.
Free for early members · No card required · Access closes soon
EMA Trend State Engine is a technical analysis tool provided for informational and educational purposes only. It does not constitute financial advice. Trading involves significant risk of loss.